Are you struggling to choose between Excel and Power BI for your data analysis needs? Look no further, because, in this blog post, we’ll be breaking down the differences and benefits of both tools to help you make an informed decision.
Excel is a powerful spreadsheet application that allows users to store, organize, calculate, and analyze data in various ways. Power BI, on the other hand, is a business intelligence platform developed by Microsoft specifically for data analysis.
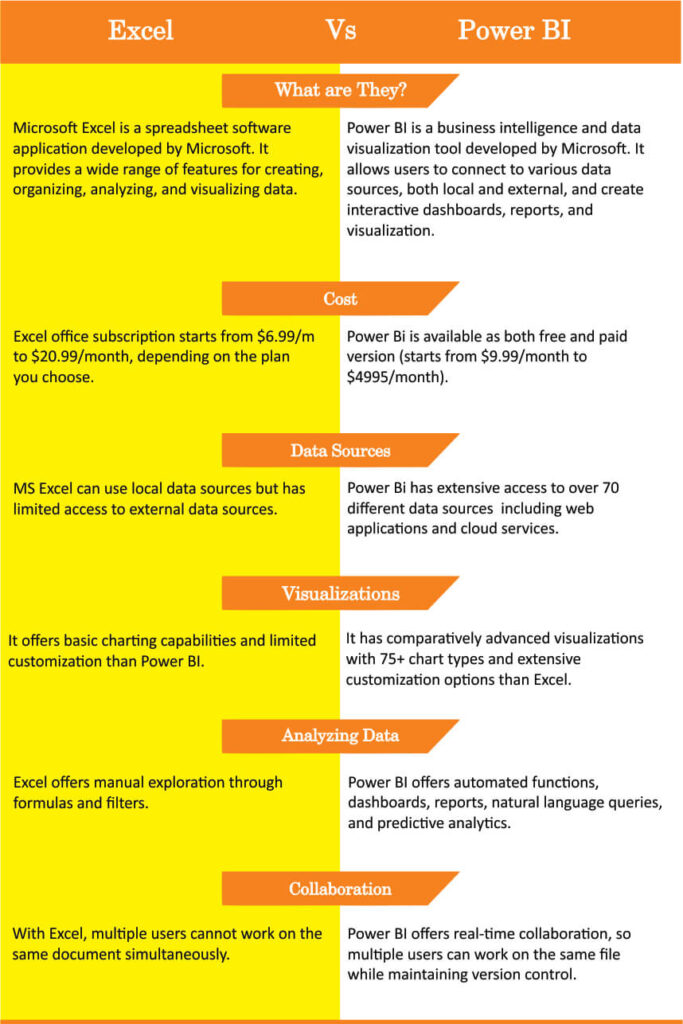
Excel Vs Power BI (Comparison Chart)
| Microsoft Excel | Power BI |
|---|---|
| Microsoft Excel is a spreadsheet software application developed by Microsoft. It provides a wide range of features for creating, organizing, analyzing, and visualizing data. | Power BI is a business intelligence and data visualization tool developed by Microsoft. It allows users to connect to various data sources both local and external, and create interactive dashboards, reports, and visualization. |
| Excel office subscription starts from $6.99/month to $20/month, depending on the plan you choose. | Power BI is available as both free and paid version(starts from $9.99 to $4995/month) |
| MS Excel can use local data sources but has limited access to external data sources. | Power BI has extensive access to over 70 different data sources including web applications and cloud services. |
| It offers basic charting capabilities and limited customization than Power BI. | It has comparatively advanced visualization with 75+ chart types and extensive customization options than Excel. |
| Excel offers manual exploration through formulas and filters. | Power BI offers automated functions, dashboards, reports, natural language queries, and predictive analytics. |
| With Excel, multiple users cannot work on the same document simultaneously. | Power BI offers real-life collaboration, so multiple users can work on the same file while maintaining version control. |
What Is Excel?
Excel is a spreadsheet application that is part of the Microsoft Office suite of productivity software. It allows users to create and format spreadsheets, as well as perform mathematical calculations on data.
Microsoft Excel also includes tools for the graphic representation of data and complex formulas to analyze information.
Moreover, Excel is one of the most popular applications for data analysis and can be used to create everything from databases to financial models. It is also widely used in businesses, schools, and other organizations.
Pros and Cons of Using Excel
Pros of Excel:
- Easy to Use: MS Excel is easy to use. It has a user-friendly graphical interface which makes it intuitive and simple to learn. This makes entering, organizing, and manipulating data a breeze.
- Versatility: MS Excel can be used for a variety of tasks including creating graphs, tracking expenses, creating financial models, and much more.
- Automation: MS Excel allows users to automate tedious procedures like sorting through data or performing calculations with the help of macros and formulas. This saves time and improves accuracy by eliminating manual entry errors.
Cons of Excel:
- Limited Data Analysis: Excel is limited in its ability to conduct sophisticated data analysis. It does not have the powerful features and capabilities of more advanced software packages like SPSS or SAS.
- Cost of Entry: Excel can become quite expensive as additional features and capabilities require the purchase of add-on software or subscription-based services.
What Is Power BI?
Power Bi, on the other hand, is a business analytics service provided by Microsoft. It has a collection of tools for analyzing data and creating interactive visualizations, dashboards, and reports.
In addition to providing these features, Power BI also offers integration with other Microsoft products such as Excel and Azure.
Moreover, Power BI has a cloud-based service called Power BI Service, which allows users to collaborate on data analysis and visualization projects. The service also provides access to a library of content packs that contain pre-built visuals, dashboards, and reports. Finally, it allows developers to create custom visuals using the R language or the Python library for Power BI.
Pros and Cons of Power BI
Pros of Power BI
- Visualization: Power BI provides an array of powerful tools for data visualization. Users can easily create stunning visuals, which add clarity and context to their data analyses.
- Usability: Power BI is user-friendly, easy to learn, and requires no extensive coding knowledge. This makes it a great tool for new users who want to get up and running quickly with data analysis and visualization.
- Connectivity: Power BI offers connectivity with multiple data sources (including Excel, Azure, Salesforce, etc.) so users have access to the most up-to-date info for their reports and dashboards.
Cons of Power BI
- Cost: Power BI is not free. While the basic version of the product is included in most Office 365 subscriptions, prices can quickly increase with the addition of data storage, premium features, and other services.
- Complexity: Power BI requires extensive knowledge of data analytics and visualization techniques to get the most out of its features. This complexity makes it difficult for novice users to take advantage of all that Power BI has to offer without assistance from an experienced user.
Key Differences Between Excel and Power BI
- What are They – Excel is a spreadsheet software application developed by Microsoft whereas Power BI is a business intelligence and data visualization tool developed by Microsoft too.
- Data Sources – Excel can use local data sources such as CSV files or SQL databases, but it cannot access external data sources like web applications or cloud services. On the other hand, Power BI has access to external data sources out of the box and provides quick access to over 70 different data sources including Salesforce and Google Analytics.
- Analyzing Data – Excel is more suited for manual exploration of data, as it allows users to find patterns in their data through formulas and filters. On the other hand, Power BI can automate some of these functions and provide more insight into the data with its extensive range of features such as dashboards, reports, natural language queries, and predictive analytics.
- Security – Excel does not offer a dedicated security layer like Power BI, which provides built-in security mechanisms such as row-level security and encryption for protecting user data from unauthorized access.
Comparing Excel vs Power BI Functionality
When trying to decide if you should use Excel or Power BI for your business needs, it’s important to understand the difference in functionality between the two. Here, we take a look at some of the key areas of functionality that differ between Excel and Power BI:
– Data sourcing and Preparation: In Excel, you can connect to a variety of data sources and prepare your data using the built-in tools. Power BI also offers a range of data sources and preparation features but with more granular control.
– Visualizations and Reports: Excel offers a wide range of visualization options, but Power BI provides more flexibility and customizability. Power BI also allows you to create interactive reports that can be embedded on websites or shared with others.
– Collaboration and Sharing: Excel has limited collaboration features, whereas Power BI allows you to share your work with others and work on reports together in real-time.
When to Use Excel vs. Power BI
There are a few key differences between Excel and Power BI that you should consider when deciding which tool to use for your data analysis needs.
Excel is better suited for smaller data sets and simple analysis, while Power BI is designed for larger data sets and more complex analysis. Power BI also offers a more user-friendly interface than Excel, making it easier to get started with and use on a daily basis.
If you’re not sure which tool is right for you, a good rule of thumb is to start with Excel and only move to Power BI if you find yourself outgrowing the capabilities of Excel.
Conclusion
So to wrap up, we can say that Excel and Power BI are two powerful tools that can be used to analyze data and make data-driven decisions. While both have their own unique advantages, it ultimately boils down to the user’s individual needs when deciding which one is best for them.
Excel is a great choice for those looking for an easy way to manage simple spreadsheets, while Power BI is ideal for more complex analytical tasks. Regardless of what you choose, these tools provide invaluable insights that can help any organization make better business decisions.